 Earth's magnetic field is also known as the geomagnetic field, is the magnetic field that
extends from the Earth's interior out into space (left figure).
It serves to deflect most of the solar wind, whose charged particles would otherwise strip
away the ozone layer that protects the Earth from harmful ultraviolet radiation (left figure).
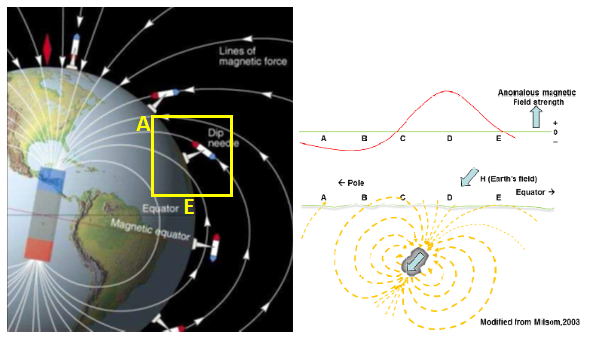
The magnetic anomaly for magnetic object Earth Magnetic Field-induced magnetic particle in the rock (b)
to produce total component (T) (right figure).
Earth's magnetic field (H) induces magnetic particles in rocks and produces total components commonly
referred to as Total Magnetic Intensity (TMI). TMI values are usually measured using a magnetometer.
Earth's magnetic field is also known as the geomagnetic field, is the magnetic field that
extends from the Earth's interior out into space (left figure).
It serves to deflect most of the solar wind, whose charged particles would otherwise strip
away the ozone layer that protects the Earth from harmful ultraviolet radiation (left figure).
The magnetic anomaly for magnetic object Earth Magnetic Field-induced magnetic particle in the rock (b)
to produce total component (T) (right figure).
Earth's magnetic field (H) induces magnetic particles in rocks and produces total components commonly
referred to as Total Magnetic Intensity (TMI). TMI values are usually measured using a magnetometer.
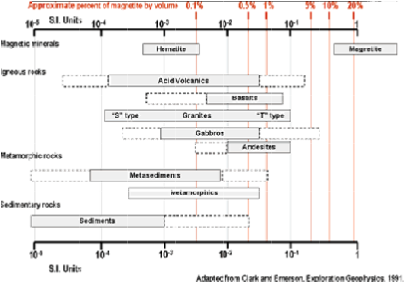
The most important elements in rocks that affect the magnetism properties of rocks are iron and magnesium,
which are Fe2+, Fe3+, and Mg+ ions.
Left figure shows the Susceptibility value for rocks (Clark & Emmerson, 1991).
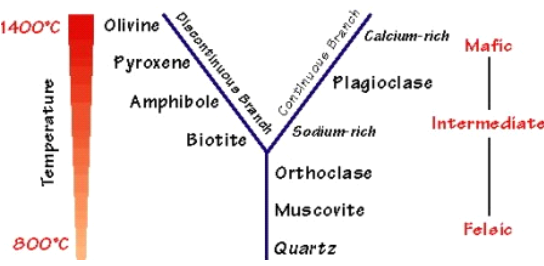
Bowen series in the right figure (Bowen, 1928) below shows mineral contains of the rocks.
Magnetic properties will be decrease from the mafic to felsic.
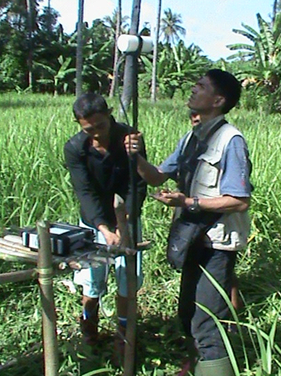
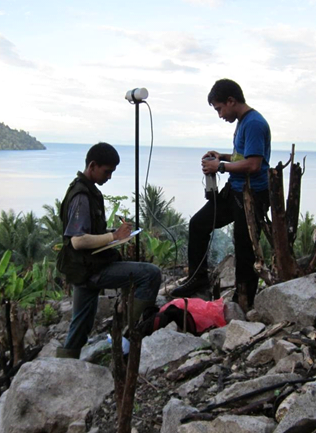
Magnetic measurements must be carried out using two sets of magnetometer instruments,
one set is used to measure the total magnetic intensity at each desired position (survey area)
or we call it Rover (right figure). Another set (left figure) is used to measure at the same position
periodically during the magnetic survey, which is free from metal object or electricity that can cause
magnetic noise (a.k.a. Base Station).
 Magnetic reading can be very erratic when a solar storm disrupts the configuration of ions in the atmosphere.
This phenomenon can only be detected by a magnetometer.
These fluctuating values are monitored by the base station to correct the magnetic readings made in the survey area.
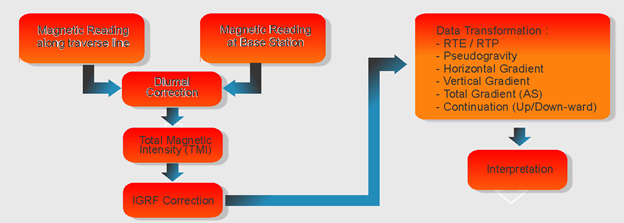
The flowchart of magnetic measurement basically consists of reading at survey area and base station,
a diurnal correction which can yield Total Magnetic Intensity. Data transformation as anomaly enhancement such as
reduce to equator/pole, pseudo gravity, horizontal gradient, vertical gradient, total gradient (analytic signal),
up/down-ward continuation.
Magnetic reading can be very erratic when a solar storm disrupts the configuration of ions in the atmosphere.
This phenomenon can only be detected by a magnetometer.
These fluctuating values are monitored by the base station to correct the magnetic readings made in the survey area.
The flowchart of magnetic measurement basically consists of reading at survey area and base station,
a diurnal correction which can yield Total Magnetic Intensity. Data transformation as anomaly enhancement such as
reduce to equator/pole, pseudo gravity, horizontal gradient, vertical gradient, total gradient (analytic signal),
up/down-ward continuation.
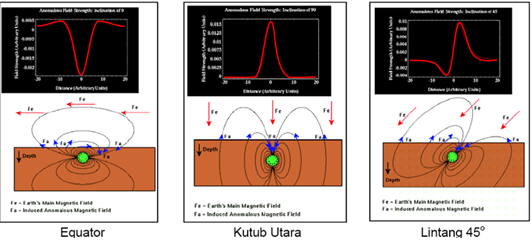
Figure below shows respond of magnetic data because of magnetize object in different latitude.
This shows before we can interpret magnetic data we need to do reduce to pole or reduce to equator method for
the magnetic data (von Frese, 2003).
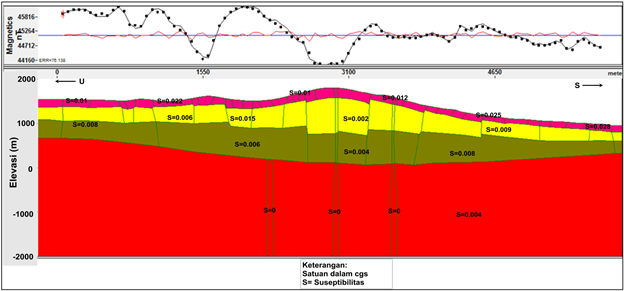
The 2D Magnetic data can be used to construct subsurface model. Geomagnetic model of susceptibility property of
the rock to identified geothermal system of Manglayang Mountain in Bandung, West Java (Rizky, 2015).