In the first quarter of 2022, after a long holiday because of Covid19, Taman Mini Indonesia Indah (TMII) will do a big reconstruction and restoration of their arena. Well, this condition of area that has been empty for a long time is indeed the right time to do some development before reopening to the public after being closed for a long time due to PPKM and lockdown.
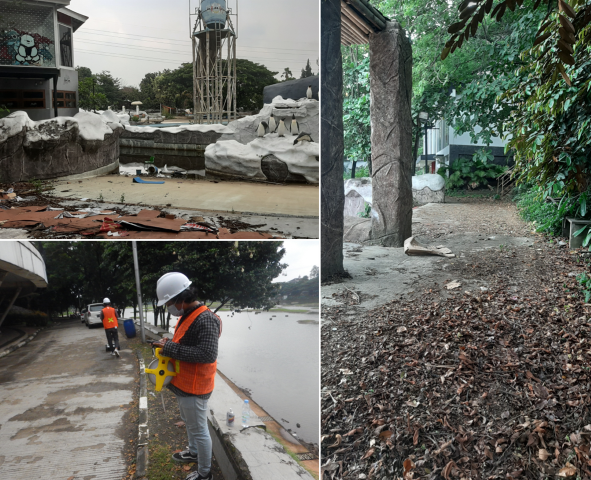
Before carrying out the development, several documents are needed, such as a map of the distribution of utilities under the surface. This document is required so that the construction process does not damage existing utilities. Unfortunately, the existing data does not exist. The condition of TMII, which had been built since 1972, meant that development document archives were not stored properly, because at that time, data storage was not as simple and easy as it is now. Another alternative is to regenerate the new map. Then how to map the utility beneath the surface that is invisible to our eyes directly? GPR is the solution!
Ground Penetrating Radar (GPR) also known as Georadar. It is method from geophysical engineering that use the propagation of electromagnetic waves that respond to changes in electromagnetic properties of the medium below the surface. The speed of electromagnetic wave propagation is the main controlling factor in the occurrence of reflection events, which are highly determined by the contrast in relative permittivity values between the background medium (embedding media) and buried/target object, or can be a contrast between layers.
The GPR method works by having a frequency range from 25 MHz to 2 GHz (2000 MHz). There are several option for antenna frequency. It varies according to the purpose of the survey or investigation. Selection of an antenna with a higher frequency allows better resolution results, but the target depth is shallower. On the other hand, selecting an antenna with a lower frequency allows for a deeper target depth, but with a less good resolution.
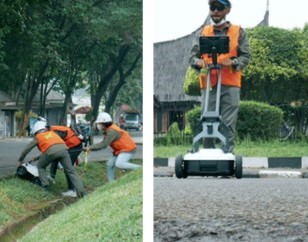
GPR survey activities at the TMII, it was carried out to mapping existing utilities at their area. So it is necessary to investigate the utilities at shallower area with best resolution data. This survey activity requires a GPR antenna that has a medium frequency at so that the depth and the data resolution obtained can be more optimal. An antenna with a frequency of 450 MHz has been selected to mapping the utilities with depth targets of less than six meters.
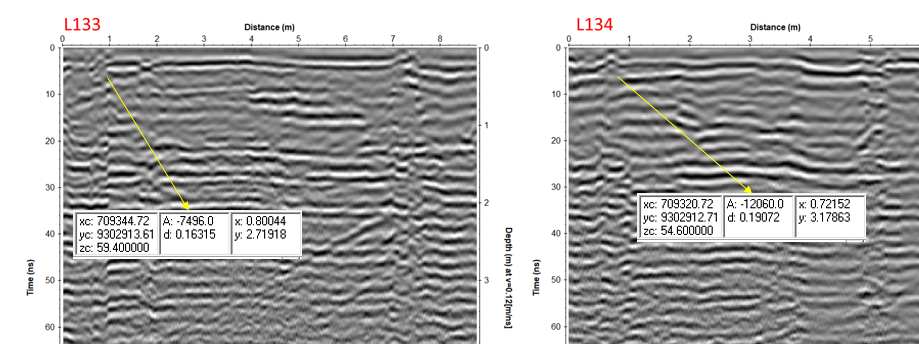
After all GPR lines are obtained, the data is processed so that it can be interpreted. Interpretation is done by looking at the anomalies that appear in each line of the georadar section. Utilities that are below the surface will show the hyperbolic anomaly as shown in the figure. Then these anomalies are connected according to the shape of a hyperbolic anomaly that is similar and has parallels with other lines. The final result is a sketch of the interpretation of subsurface utility distribution that can be used as supporting data in construction preparation.